
|
Three network-assisted prediction methods by WormNet version 3

- Phenotype-centric prediction: find new members of a pathway
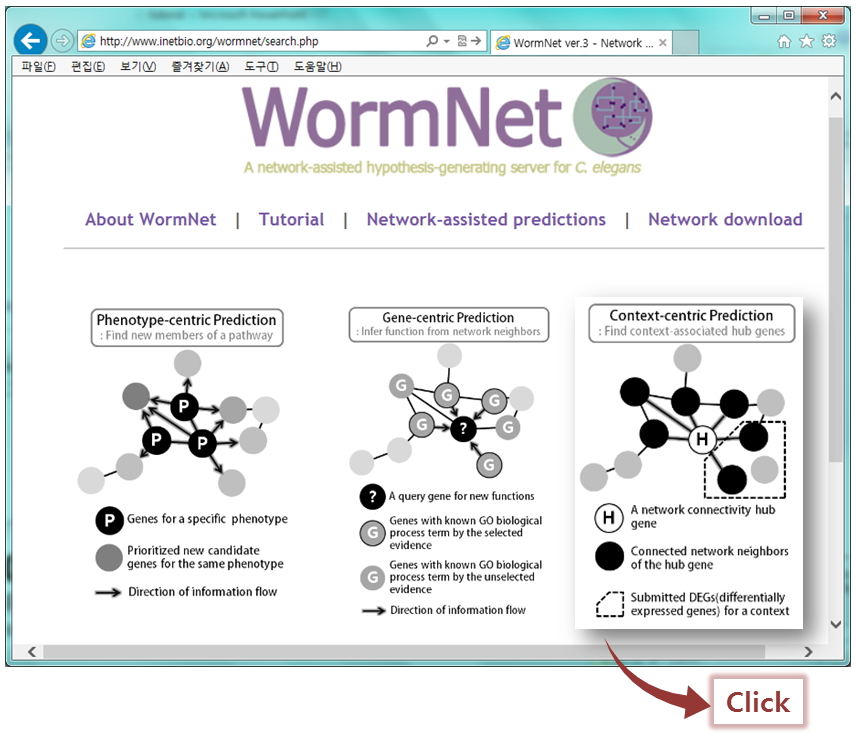
'Phenotype-centric method' predicts new candidate genes for a phenotype. Because functionally associated genes are connected one another in the network, highly connected genes to known genes(query genes) are probable members of the pathway(phenotype). This method returns 200 candidate genes based on the connectivity to known genes for a phenotypes. go to tutorial
- Gene-centric prediction: Infer functions from network neighbors
'Gene-centric method' infers functions from its network neighbors. Genes with same GO-BP(Gene Ontology-Biological process) terms are known to be involved in the same pathway, and therefore, are close each other in the network. This makes it possible to infer unknown functions of a gene(a query gene) from GO-BP terms of close neighbors. This method suggests gene functions by providing 10 candidate GO-BP terms. go to tutorial
- Context-centric prediction: Find context-associated hub genes
'Context-centric prediction' finds context-associated hub genes. Important genes for a specific biological context are represented as hubs in the network because they are related to many genes involved in that context. Using pre-defined sub-network of hub and their connected neighbors, this method finds context-associated hubs whose neighbors are enriched among DEGs(differentially expressed genes) relevant to the context. go to tutorial
Phenotype-centric prediction
Query submission
- Go to 'Network-assisted prediction' page and choose 'Phenotype-centric prediction' .

- Insert query genes in the text box.
- Or click 'toy example' button to insert genes for a test run.
- Toy example : 29 genes showing loss-of-function phenotype of lifespan extension (Hansen et al. 2005)
- Click 'submit' button, and then wait for 1~2 minutes to see a result page

-
Interpretation of the results
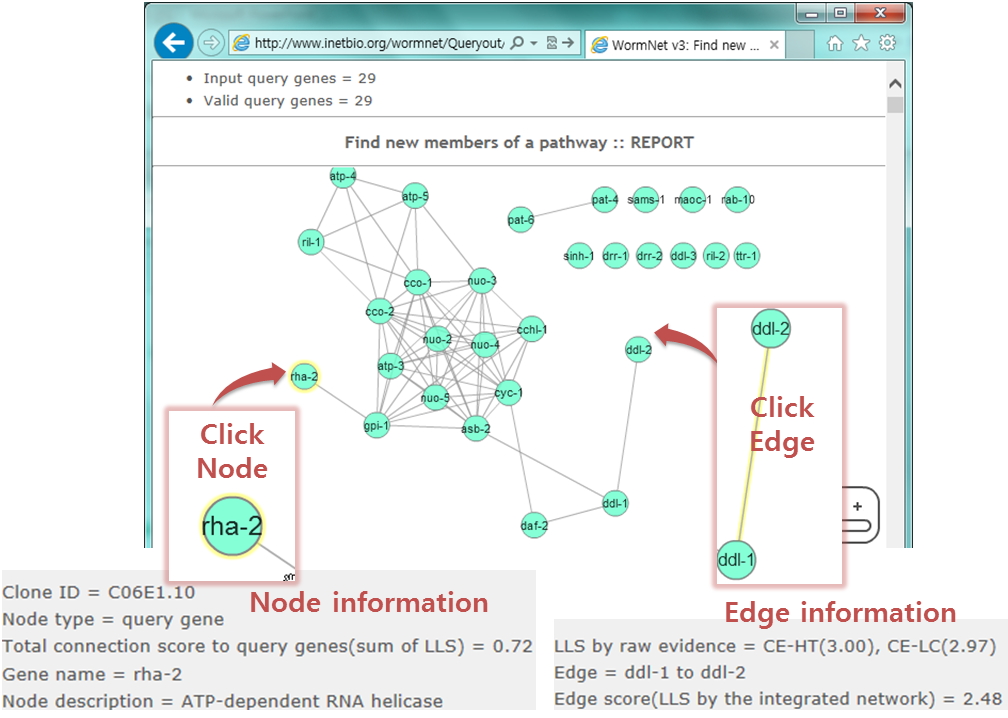
- At the top of the candidate search page, a network of query genes will appear with an interactive browser, Cytoscape web.
- Network visualization by Cytoscape web requires installation of adobe flash player
- You can see 'node information' and 'edge information' by clicking a node or an edge.
- the chosen node or edge will be highlighted.
- A list of inter-connected query genes
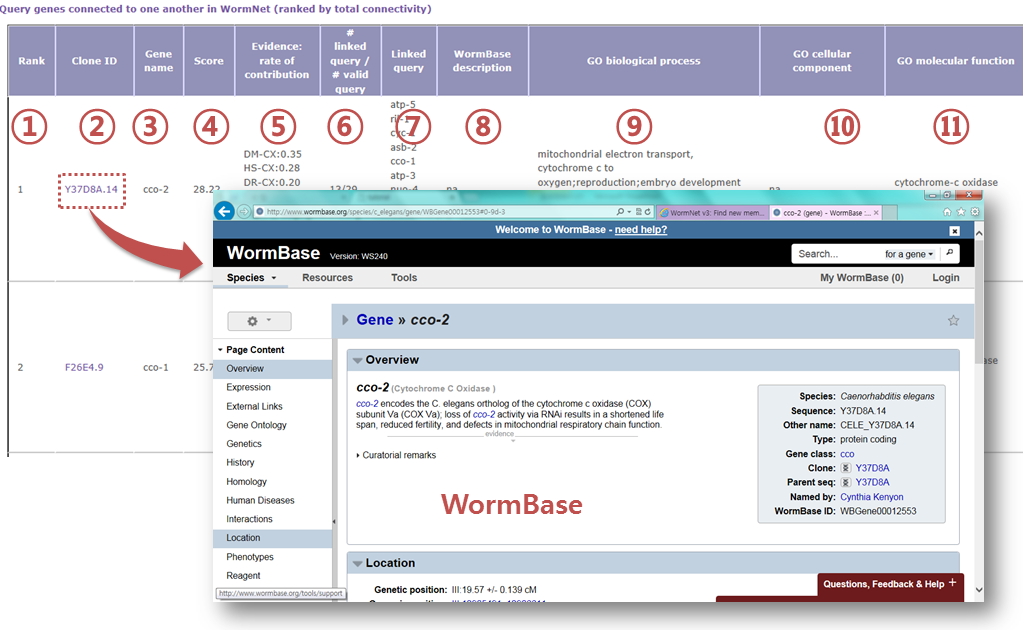
Query genes connected to one another in the network for analysis are listed with ranked order. In addition, other related information is summarized in the table.
- Rank by total connectivity: Guilt-by-association principle prioritizes query genes from most connected to other query genes.
- Clone ID: If you click the clone ID, it will direct to the gene information page of WormBase
- Gene name: gene symbol (if available)
- Score: Sum of LLS (Log Likelihood Scores) of network links to all other query genes
- Evidences: a list of all evidences (see network download page) supporting network-based prediction and their contribution (indicated by fraction of the prediction score)
- # linked query/ # valid query: the number of linked query genes over the total number of valid query genes
- Linked query genes: a list of all query genes that connect to the candidate gene
- WormBase description: gene annotations from WormBase(if available)
- GO biological process: all GO biological process annotations for the candidate gene
- GO cellular component: all GO cellular component annotations for the candidate gene
- GO molecular function: all GO molecular function annotations for the candidate gene
These inter-connected query genes may represent the core pathway of the phenotype. As an optional analysis, you can search for candidate genes for the phenotype using only these inter-connected query genes. That will generate another report page for the same network.

- A list of disconnected query genes

The function of these disconnected query genes can be inferred by 'gene-centric prediction' as an optional analysis. Go to 'gene-centric prediction' for more details.

- Area under ROC curve
If the query genes (known genes for a phenotype) are well connected to one another by the network, other genes connected to the query genes are highly likely to be new candidate genes for the phenotype. Therefore, we may estimate prediction power of the network for a phenotype by measuring inter-connectivity among query genes.
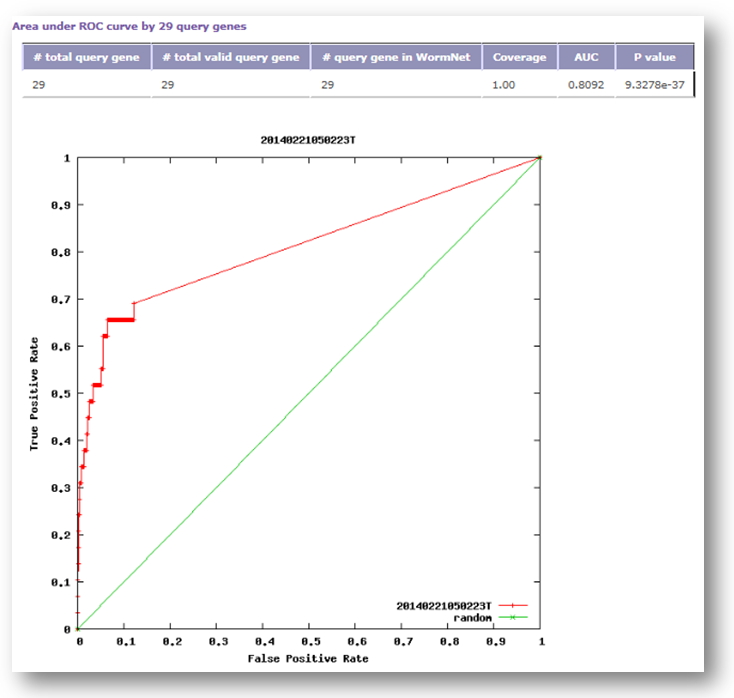
Candidate genes are ranked by connectivity scores to the query genes. Thus, query genes that are well connected to one another will be highly ranked. Prediction power by the rank orders can be assessed by Receiver Operating Characteristic (ROC) curve which represents the true positive (TP) rate for the given cost of false positive (FP) rate as described below.- y axis: true-positive (TP) rate

- x axis: false-positive (FP) rate

- The green line represents ROC curve by random prediction.
- The ROC curve is summarized as a single score, Area under the ROC curve (AUC), wihch is a numerical measure of prediction power.
- AUC = 0.5: random prediction power
- AUC = 1: perfect prediction power
- The table shows statistics of query genes:
- the number of total query genes
- the number of total valid query genes
- the number of query genes in the network
- Coverage: fraction of the genes in network
- AUC: Area Under ROC curve
- You can also see a network of extended gene set (query genes + top 200 candidate genes) or a network of all gene set (query genes + all connected neighbors).
- y axis: true-positive (TP) rate
- A list of top 200 new candidate genes

- You may search for enriched GO terms and KEGG pathways based on Fisher's exact test using
- Inter-connected query genes
- All query genes
- All query genes and top 200 new candidate genes
- Only GO terms and KEGG pathways with P-value<0.05 are listed.
- To start Gene set analysis,
- Select a gene set.
- Copy and paste genes into the text box.
- Click 'submit' button.


Gene-centric prediction
Query submission
- Go to 'Network-assisted prediction' page and choose 'Gene-centric prediction' .
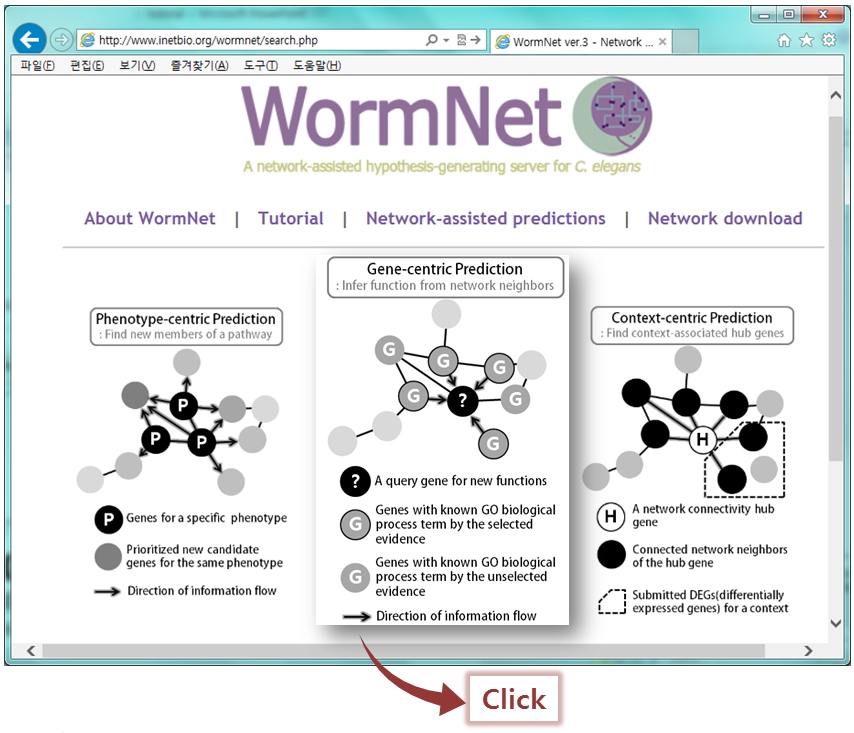
- Choose GO annotation evidence code(s)
- Inferred functions from network neighbors can vary depending on selected evidences tha support GO-BP annotations of the neighbors, because the prediction counts only GO-BP terms supported by selected evidences for the analysis.
- For the prediction with high reliability, the default prediction setting uses only 7 reliable evidences(IDA, IMP, IGI, IPI, IEP, TAS, ISS), which can be modified by users.
- For more information about GO evidence code, refer to the GO evidence code table below in the query page.
- Insert query genes in the text box.
- Or click 'toy example' button for a test run.
- Click "toy example" to run test prediction using example query genes.
- Toy example : 11 genes with updated GO-BP terms for 'reproduction' between November 2011 and February 2014.(the server use gene annotation information by November 2011)
- You will see 'reproduction' as a top 10 predicted GO-BP term.
- These are validated by new annotation on February 2014.
- Click 'submit' button, and then wait for 1~2 minutes to see a result page

Interpretation of the results
- A list of top 10 candidate GO-BP terms for a query gene.
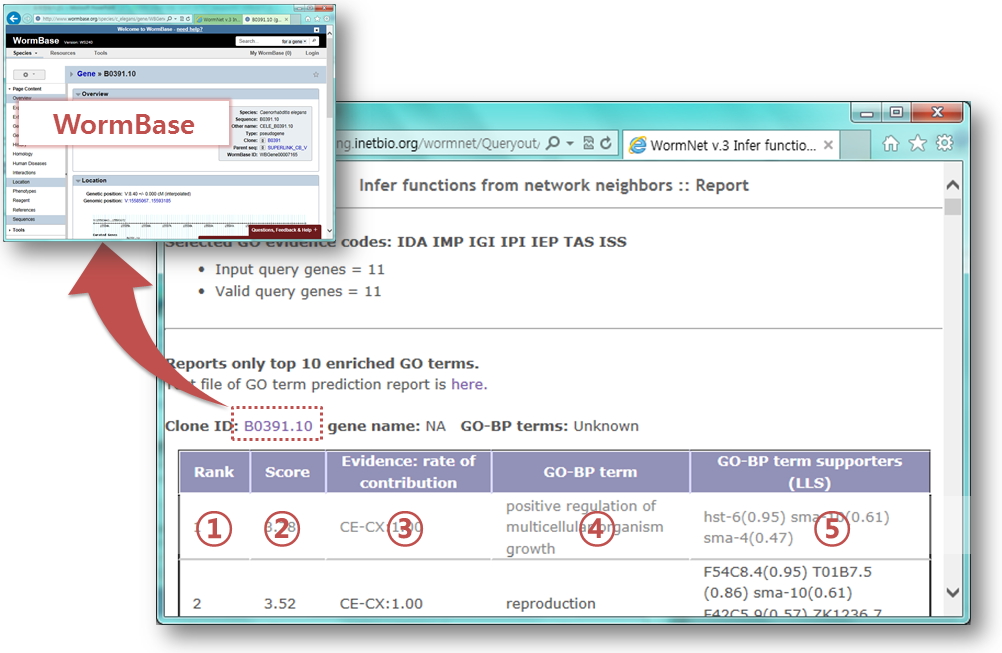
Predicted GO-BP terms are listed with ranked order. In addition, other related information helpful for inferring gene functions are summarized in the table. If you click the clone ID, it will direct to the gene information page of WormBase
- Rank: Total connectivity to genes with GO-BP terms from selected evidences.
- Score: Sum of LLS (Log Likelihood Scores) of network links to genes with GO-BP terms from selected evidences.
- Evidences: a list of all evidences (see network download page) supporting network-based prediction and their contribution (indicated by fraction of the prediction score)
- GO biological process: all GO biological process annotations for the candidate gene
- GO biological process supporters: neighbor genes with GO-BP terms from selected evidences and their contribution(indicated by LLS to the query genes)
Context-centric prediction
Query submission
- Go to 'Network-assisted prediction' page and choose 'Context-centric prediction' .
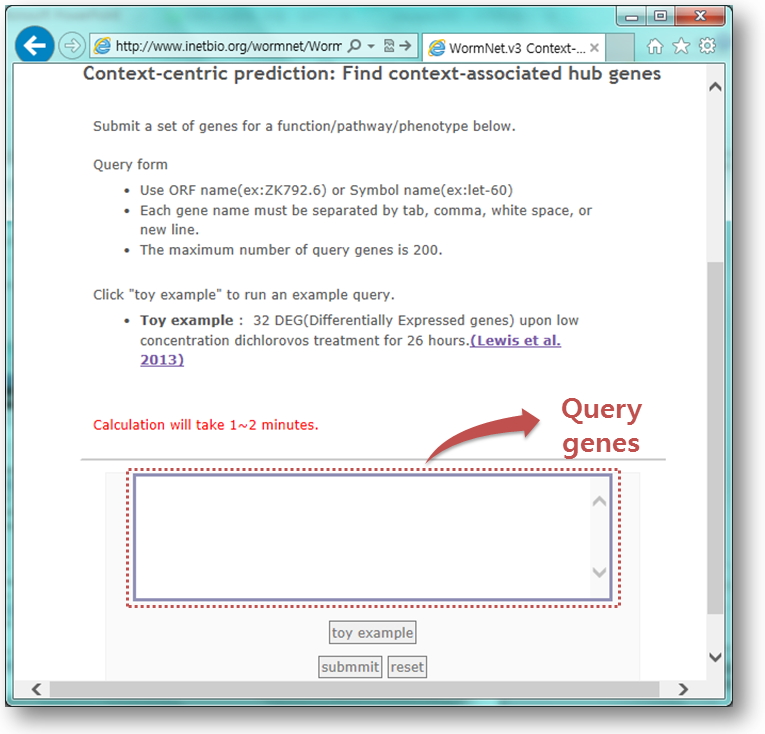
- Insert query genes in the text box.
- Or click 'toy example' buttons for a test run.
- Click "toy example" to run an example query.
- Toy example: 32 DEG(Differentially Expressed genes) upon expose to low concentration dichlorovos for 26 hours.(Lewis et al. 2013)
- Click 'submit' button, and then wait for 1~2 minutes to see a result page
Interpretation of the results
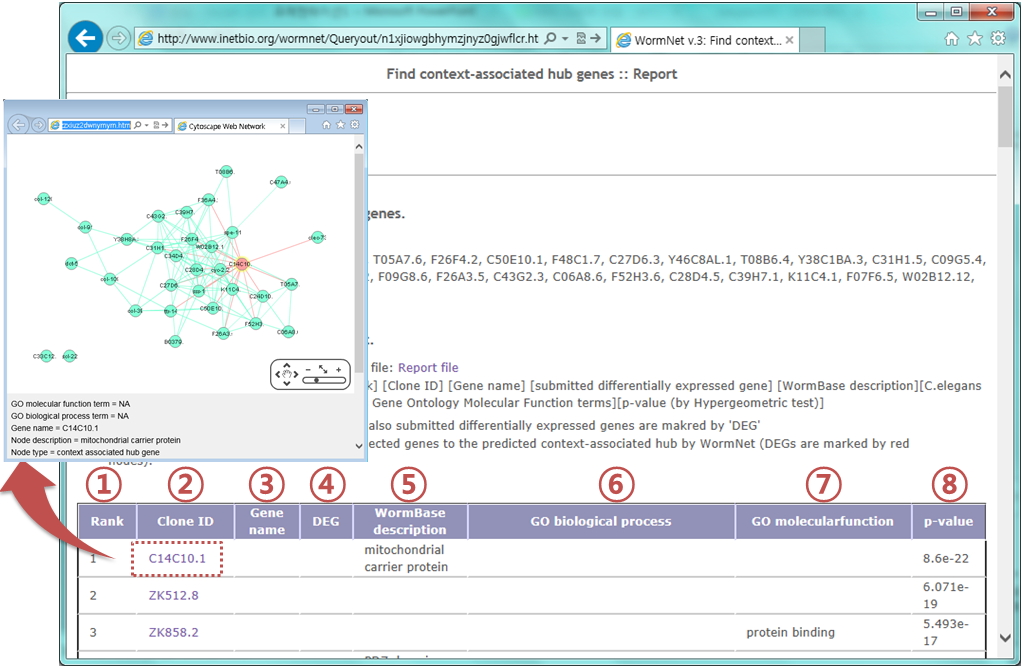
- A list of top 10 candidate context-associated hubs.
Predicted context-associated hubs are listed with ranked order. In addition, other related information is summarized in the table.
- Rank by P-value: Statistical enrichment of hub's neighbor with user-submitted DEG prioritizes query genes from most connected to other query genes.
- Clone ID: If you click the clone ID, sub-network of selected query genes and their connected neighbors will appear with interactive mode.(it requires adobe flash player)
- Gene name: gene symbol (if available)
- DEG: whether the predicted hub is user-submitted DEG(differentially expressed gene)
- WormBase description: gene annotations from WormBase(if available)
- GO biological process: all GO biological process annotations for the context-associated hub gene.
- GO molecular function: all GO molecular function annotations for the context-associated hub gene.
- P-value: by Fisher's exact test
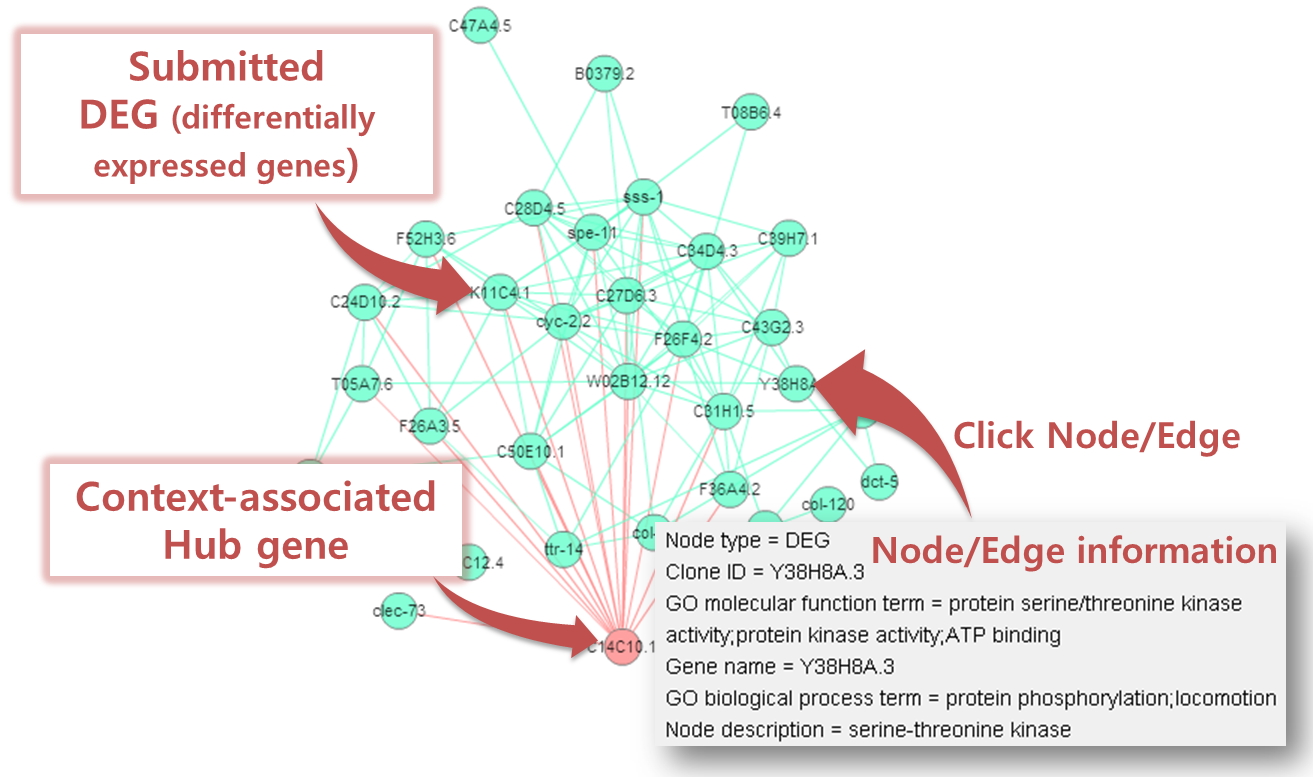
- Associated sub-network
- Predicted context-associated hub gene is marked by cyan.
- User-submitted DEGs are marked by red.
- You can see 'node information' and 'edge information' by clicking a node or an edge.
- The chosen node or edge will be highlighted.
- A list of top 10 candidate GO-BP terms for a query gene.
Predicted GO-BP terms are listed with ranked order. In addition, other related information helpful for inferring gene functions are summarized in the table. If you click the clone ID, it will direct to the gene information page of WormBase